


 41 / 44

2017 Logan County Farm Outlook Magazine
LINCOLN DAILY NEWS
March 23, 2017
Page 41
For a full listing of reported counties you may visit the website at:
http://www.nass.usda.gov/Statistics_by_State/Illinois/Publications/County_Estimates/Select the crop you would like to see county level information for.
Year
Sangamon
Logan
Year
Sangamon
Logan
2016
230.8
219.4
10 year
average
2015
222.1
172.8
183.5
2014
2013
226.8
198.1
198.2
2012
96.5
131.3
2011
173.4
165.7
2009
2010
155.7
154.5
189
188
2008
188
184
2007
197
2015
199
181.97
185.41
2016
66.6
66.2
56.6
60.7
2014
63.7
63.3
2011
2013
56.4
55.8
2012
47.3
49.5
54.6
55.5
2010
57.6
60.4
2007
51
2009
53
2008
50
57
50
51
10 year
average
55.38
57.24
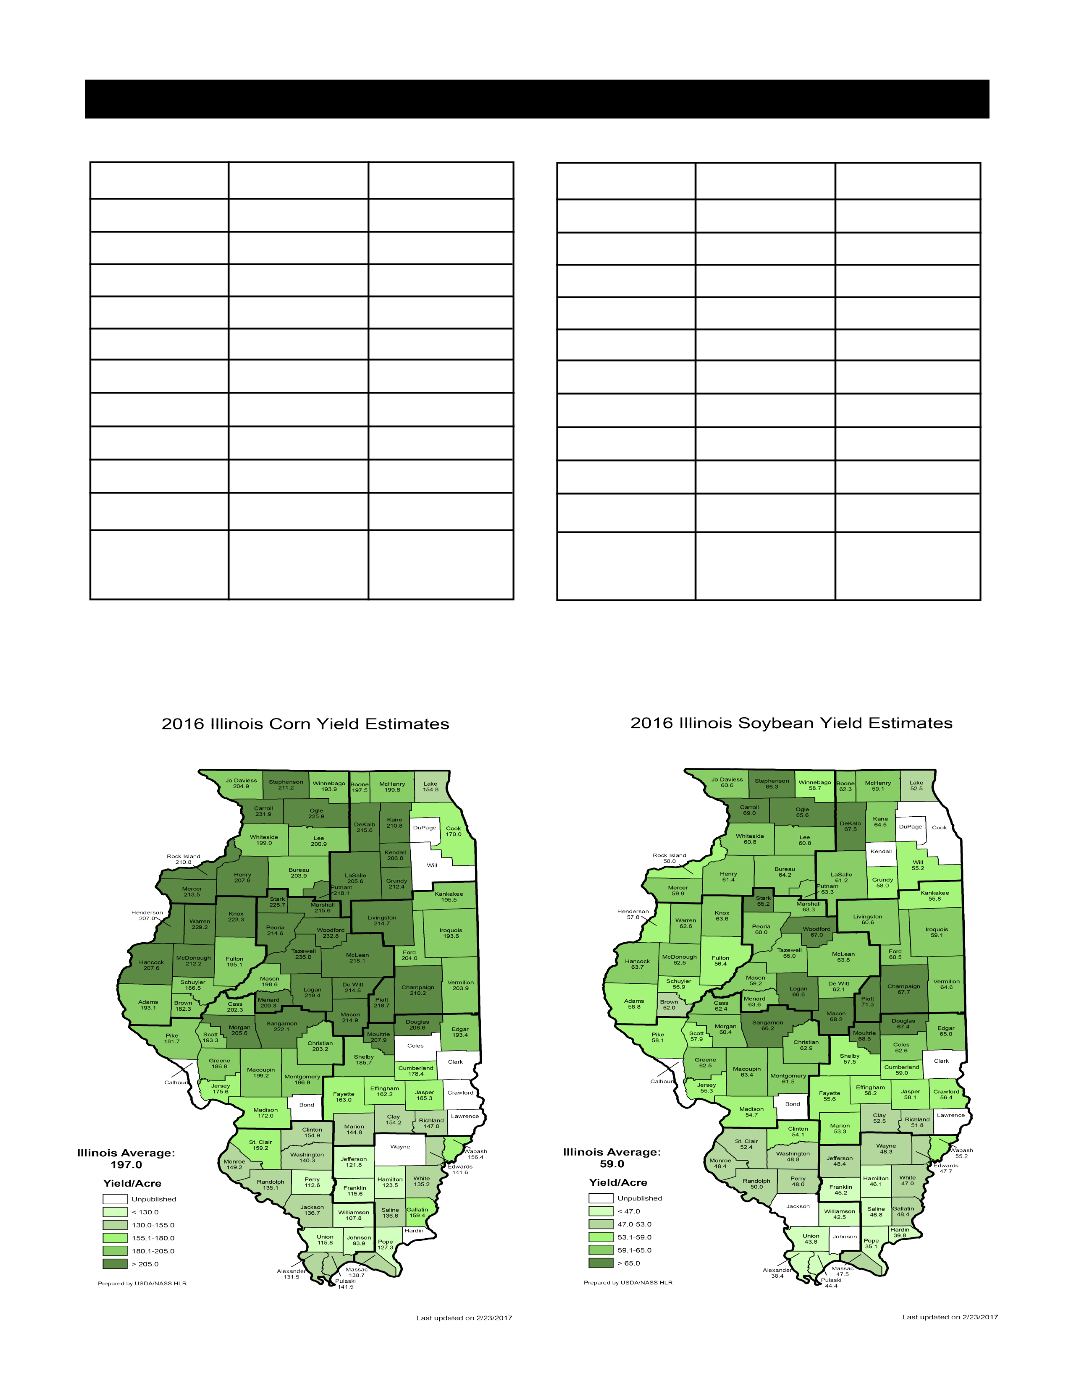
Corn
Soybean
Charts showing corn and soybean 10 yield averages for Logan and Sangamon Counties follow.